How did Turkey perform between 2002, 2008 and 2019 by macroeconomic rankings?


Last 20 years was probably one of the fastest period of human history especially in the scope of the economy. Today it is so hard to think that 20 years ago, there was no Facebook, no Instagram, no Skype, no Youtube and no Netflix. This list goes on. We are living in a different world then 2000.
Despite the fact that today is so different than the beginning of the millennium, it is still so common to measure performance of a country's economy by comparing macroeconomic factors of then and now. At least I believe in Turkey it is a common confusion to compare GDP at 2002 (when current government started working ) and today. Yes Turkey's GDP was 200 Billion $ at 2002 and today it i s 4 times this amount, but this doesn't give any information if we don't know the worldwide economic context in this period. For this reason, I have tried to analyze this performance not only in the scope of pure macro variables which are sensitive to trend changes (due to inflation or worldwide economic context) but in terms of rankings. Because ranking is not affected by by those drawbacks. Basically if a country do better than it should rank better. As it is the most common factor, I have especially focused to GDP rankings.
Before anything let's see Turkey's GDP(by current dollar) its ranking over years.
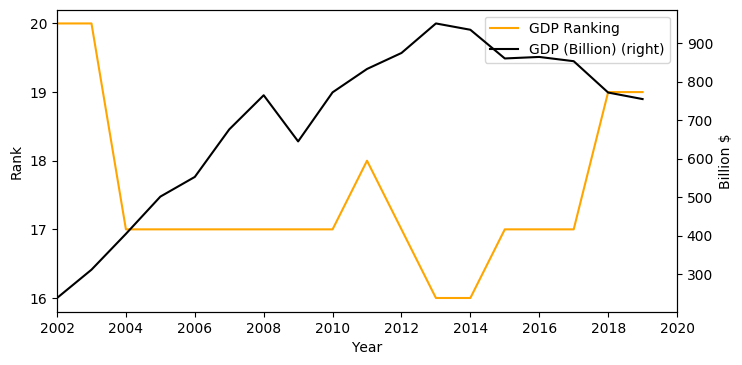
Here you can easily observe that it is not clear cut the relation. Between 2004 and 2008, GDP increases heavily while ranking is the same. For this reason we should show this information in the context of other countries. As you can see here Turkey's rankings got slightly better (x at 2002 and y now). But how did the other countries performed in the same period? Let's see
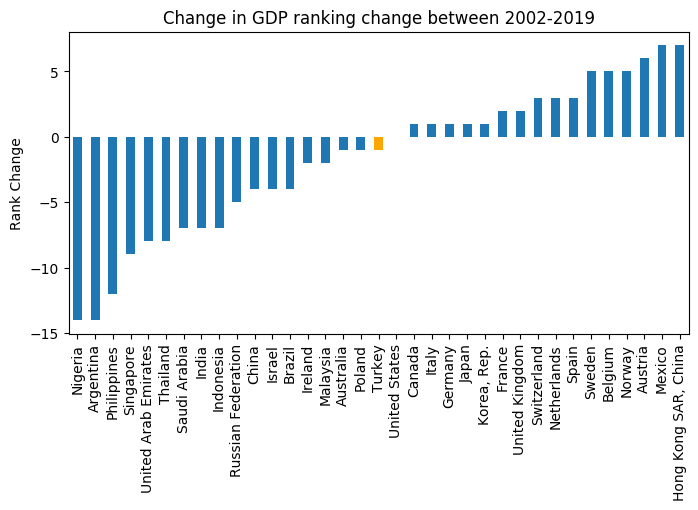
The plot above shows the change in rankings for first 35 countries with highest GDP at 2019. As you can observe in this plot actually Turkey's performance lies more or less in the middle. In the same period Turkey climbed 1 rank, Nigeria and Argentina climbed 14 ranks, India climbed 7 ranks and Russia climbed 5 ranks.
Of course ranks can't show everything. It is hard to observe Chinese miracle of last 20 years. For getting a better sense of relative growths let's now plot normalized GDP between same years.
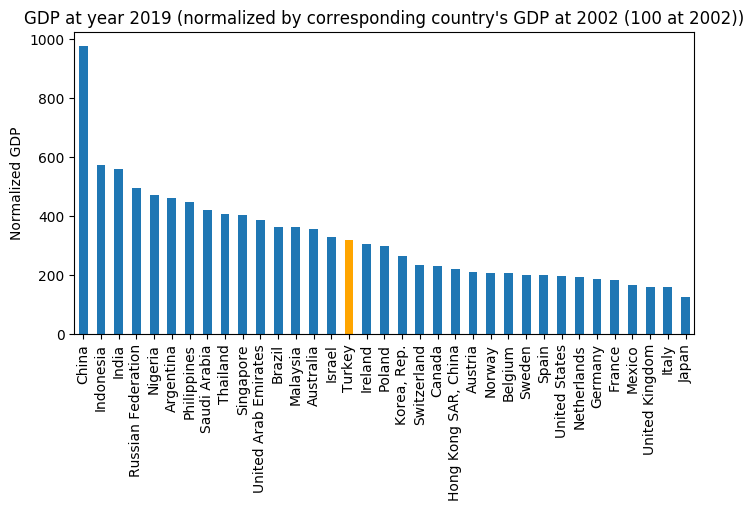
According to the above's plot, Turkey's economy definitely grew, it is actually quadrupled (of course nominally), however unlike common belief, it doesn't shine when we compare with others. China, Indonesia, Russia for example did much better.
We had taken as our start date 2002 till now, however I believe even that date is so far away and relatively irrelevant. Especially 2008 crisis changed lots of dynamics in world economy. So let's draw the plot above again but only now we will use 2008 as reference point.
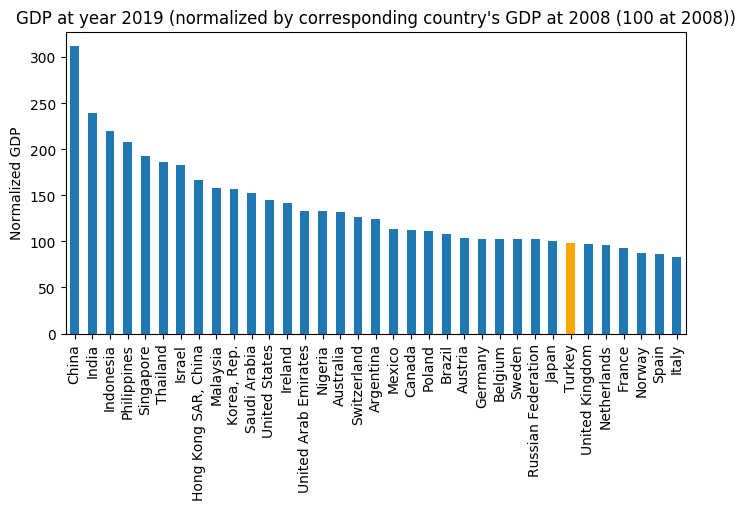
As you can see now the picture looks actually quite different. Turkey, commonly considered as developing country, even performed worse than Japan or Germany which are considered as more saturated markets.
As conclusion, I think we can easily say Turkey performed mediocre between 2002-2019 and poorly between 2008-2019. It is important to observe the illness before even beginning to treatment.
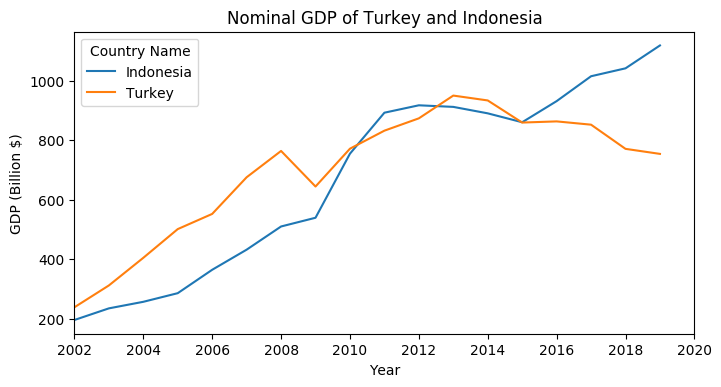
Finally let's plot Indonesia's and Turkey's GDP together.
- Data source: https://data.worldbank.org/indicator/NY.GDP.MKTP.CD - Source Code: https://github.com/verikafasi/gdp-ranking